21 如何查看各服务的健康状况——系统应用监控 各个微服务模块基本已经就位,但系统运行的情况是怎么样,有没有办法查看的到呢?本篇就带你一起看看如何查看系统运行时的一些信息。
Actuator 插件
细心的小伙伴发现了,每个微服务的 pom 文件配置中都有如下的 jar 引用,这是 Spring Boot 提供的一系列额外特性组件以帮助你监控管理运行中的系统应用。
除了需要引入对应 jar 包外,还需要指定的配置。由于默认只开放了 health、info 两个 API,其它 API 要正常使用,需将 exposure 配置项置为
/* ,才能正常使用 Actuator 暴露出来的接口。
management.endpoints.web.exposure.include=/*
下图是 Actuator 提供的所有对外接口,左上角四个是 Web 应用独有的。
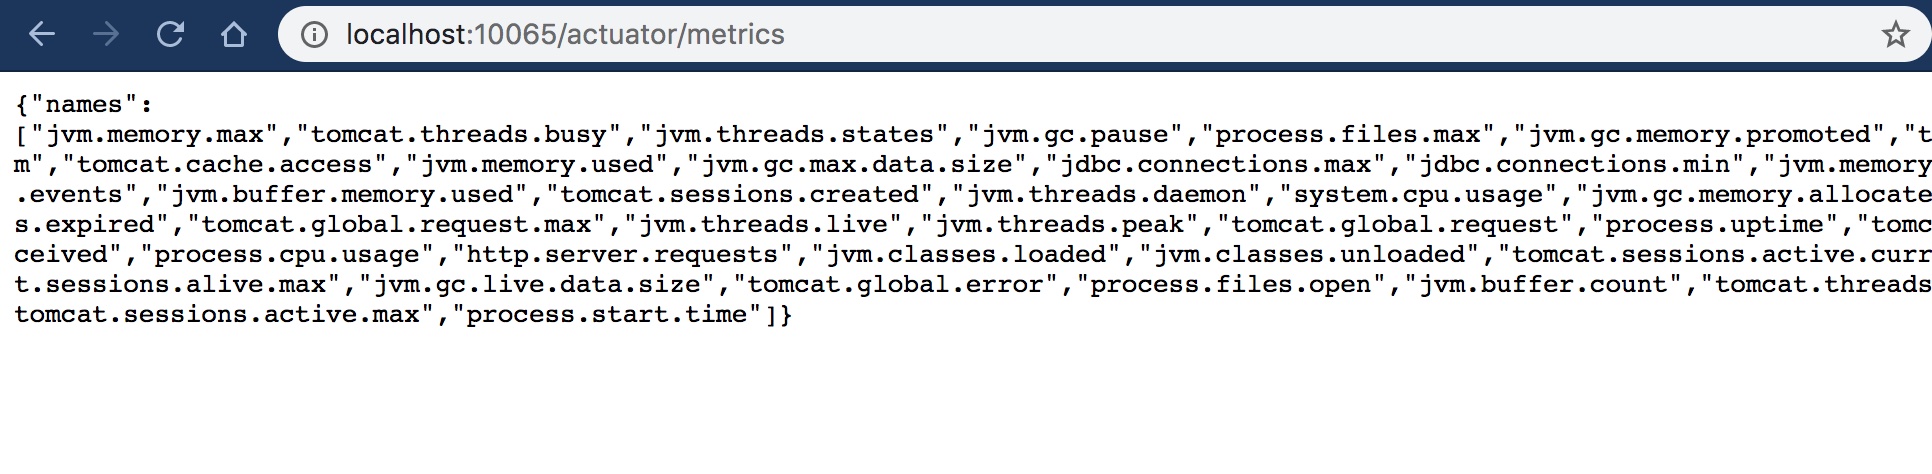
启动任意一个应用后,在浏览器中输入网址 http://localhost:10065/actuator/ 就可以查看所有接口地址,响应信息均是以 JSON 形式输出。举例,访问 http://localhost:10065/actuator/metrics,浏览器响应信息如下:
通过访问不同的地址,就可以获取关于服务的相关信息,更多 Actuator 组件相关的文档介绍可参见 Spring Boot Actuator官方文档介绍。但插件返回的信息全部是文本信息,不够直观明了,对监控者而言需要花费不少精力才能解读背后的信息。
Spring Boot Admin
这里引入 Spring Boot Admin,它是一个 Web 应用,官网地址: https://github.com/codecentric/spring-boot-admin,
它是基于 Actutor,在其上做了 UI 美化,对使用者而言可用性大大提高,下面我们来直观地体验一下。
新建监控服务端
基于 Spring Boot 快速建立 parking-admin 子模块,pom.xml 中加入依赖:
application.yml 配置文件:
server: port: 10090 management: endpoints: web: exposure: include: \/* security: enabled: false endpoint: health: show-details: ALWAYS spring: application: name: parking-admin
应用主类也很简单,增加 @EnableAdminServer 注解即可:
@EnableAdminServer @SpringBootApplication public class BootAdminApplication { public static void main(String[] args) { SpringApplication.run(BootAdminApplication.class, args); } }
启动应用后,服务端就算完工了,浏览器打开
localhost:8081 查看 Spring Boot Admin 主页面:
页面一直处于 Loading 状态,直接到有被监控端应用加入进来。
添加监控端应用
直接在相应的需要监控的模块中,引入相应的 client jar 即可。(版本建议与 spring-boot-admin-starter-server 保持一致)
相应的 application.properties 中增加配置:
/#必须暴露出来,不然admin-server无法获取health数据 management.endpoints.web.exposure.include=/* management.security.enabled=false management.endpoint.health.show-details=ALWAYS /#admin server address spring.boot.admin.client.url=http://localhost:10090
就这么两步,其它无须做过多更改,启动主程序类,我们为资源服务为例,返回监控页面,会发现资源服务实例已经被监控到,并罗列在界面中:
点击应用实例,进入更详细的信息查看,至此通过 Spring Boot Admin 实现的应用监控已可以正常使用。
监控虽然已经跨出代码开发行列,但时下 DevOps、SRE 概念的盛行,开发与运维的界线越为越模糊,合作越来越紧密,了解一些监控知识是很必要的。另外,监控微服务是任何一个微服务架构中都不可或缺的一环。但 Spring Boot Admin 仅仅只能监控应用本身的信息,应用所属的宿主机信息无法监控到,你知道有什么方法可以监控吗?
参考资料
https://learn.lianglianglee.com/%e4%b8%93%e6%a0%8f/SpringCloud%e5%be%ae%e6%9c%8d%e5%8a%a1%e5%ae%9e%e6%88%98%ef%bc%88%e5%ae%8c%ef%bc%89/21%20%e5%a6%82%e4%bd%95%e6%9f%a5%e7%9c%8b%e5%90%84%e6%9c%8d%e5%8a%a1%e7%9a%84%e5%81%a5%e5%ba%b7%e7%8a%b6%e5%86%b5%e2%80%94%e2%80%94%e7%b3%bb%e7%bb%9f%e5%ba%94%e7%94%a8%e7%9b%91%e6%8e%a7.md
更多学习
更多实时资讯,前沿技术,生活趣事。尽在【老马啸西风】
交流社群:[交流群信息](https://mp.weixin.qq.com/s/rkSvXxiiLGjl3S-ZOZCr0Q)