VictoriaMetrics
VictoriaMetrics 是一款快速、经济高效且可扩展的监控解决方案和时间序列数据库。
VictoriaMetrics提供了二进制发布、Docker镜像、Snap包以及源代码的形式供用户使用。
VictoriaMetrics的集群版本可以在此处找到。
WSL 的 docker 管理
在Linux系统中,使用Docker通常涉及几个基本步骤,包括安装Docker、启动Docker服务、获取(pull)Docker镜像以及运行(run)容器。以下是使用sudo snap install docker命令安装Docker后,运行Docker容器的基本步骤:
-
安装Docker:您已经通过
snap安装了Docker。sudo snap install docker -
启动Docker服务:安装完成后,您需要启动Docker服务。
sudo systemctl start snap.docker.dockerd.service或者使用简写:
sudo systemctl start docker -
设置Docker开机启动:如果您希望Docker在开机时自动启动,可以使用以下命令:
sudo systemctl enable snap.docker.dockerd.service -
获取Docker镜像:您可以从Docker Hub或其他Docker镜像仓库拉取(pull)所需的镜像。例如,要拉取Ubuntu的官方镜像:
sudo docker pull ubuntu -
运行Docker容器:使用拉取的镜像运行一个新的容器。例如,运行一个Ubuntu容器并启动一个交互式shell:
sudo docker run -it ubuntu /bin/bash这里,
-it参数让Docker提供一个交互式终端,ubuntu是指定的镜像名,/bin/bash是您希望在容器内部运行的命令。 -
管理Docker容器:您可以使用Docker命令行工具来管理容器,例如列出正在运行的容器:
sudo docker ps或者查看所有的容器(包括未运行的):
sudo docker ps -a -
退出容器:在容器内部,您可以通过输入
exit命令或按Ctrl+D来退出当前的shell会话。 -
停止容器:当您退出容器的交互式会话时,容器通常会停止运行。要手动停止一个正在运行的容器,可以使用:
sudo docker stop container_name_or_id -
删除容器:如果需要删除一个容器,可以使用:
sudo docker rm container_name_or_id
请注意,如果您使用的是较新版本的Docker,可能需要将用户添加到docker组,以便无需使用sudo来运行Docker命令:
sudo usermod -aG docker ${USER}
然后,您需要注销并重新登录,或重新启动系统,以使组变更生效。
以上步骤应该可以帮助您在安装Docker后运行容器。
如果遇到任何问题,请参考Docker的官方文档或社区论坛获取帮助。
docker 版本
$ docker -v
Docker version 24.0.5, build 24.0.5-0ubuntu1~22.04.1
install
创建文件夹:
mkdir -p /home/dh/victoria-metrics-data:/victoria-metrics-data
下载运行:
$ docker run -d -p 8428:8428 -v /home/dh/victoria-metrics-data:/victoria-metrics-data --name victoria-metrics victoriametrics/victoria-metrics:v1.95.1
对应的效果:
$ docker ps

CONTAINER ID   IMAGE                                      COMMAND                  CREATED          STATUS          PORTS                                       NAMES
3b265f2c6f96   victoriametrics/victoria-metrics:v1.95.1   "/victoria-metrics-p…"   50 seconds ago   Up 49 seconds   0.0.0.0:8428->8428/tcp, :::8428->8428/tcp   victoria-metrics
WSL 重新启动失败问题
通过 docker ps 没看到,但是重新启动失败。
发现是 docker ps -a 才能看到全部的全部的,包括已经停止的服务。
查看所有服务
$ docker ps -a
CONTAINER ID   IMAGE                                      COMMAND                  CREATED       STATUS                      PORTS

                          NAMES
a9b88e77fe5e   deepdiver/docker-oracle-xe-11g             "/bin/sh -c 'sed -i …"   3 days ago    Exited (255) 16 hours ago   0.0.0.0:49160->22/tcp, :::49160->22/tcp, 0.0.0.0:49161->1521/tcp, :::49161->1521/tcp, 0.0.0.0:49162->8080/tcp, :::49162->8080/tcp
                          oracle
3b265f2c6f96   victoriametrics/victoria-metrics:v1.95.1   "/victoria-metrics-p…"   9 days ago    Exited (255) 3 days ago     0.0.0.0:8428->8428/tcp, :::8428->8428/tcp
                          victoria-metrics
b349fcd8e1b1   tdengine/tdengine                          "/tini -- /usr/bin/e…"   6 weeks ago   Created

                          xenodochial_hugle
6649ff543d1d   tdengine/tdengine                          "/tini -- /usr/bin/e…"   6 weeks ago   Exited (255) 3 weeks ago    0.0.0.0:6030->6030/tcp, :::6030->6030/tcp, 0.0.0.0:6041->6041/tcp, :::6041->6041/tcp, 0.0.0.0:6043-6049->6043-6049/tcp, :::6043-6049->6043-6049/tcp, 0.0.0.0:6043-6049->6043-6049/udp, :::6043-6049->6043-6049/udp   admiring_pare
关闭不需要的服务
不太需要,服务可以停止。6649ff543d1d 换成对应的 id
docker stop 6649ff543d1d
启动 vm
启动命令:
docker start 3b265f2c6f96
确认:
$ docker ps
CONTAINER ID   IMAGE                                      COMMAND                  CREATED      STATUS         PORTS                                       NAMES
3b265f2c6f96   victoriametrics/victoria-metrics:v1.95.1   "/victoria-metrics-p…"   9 days ago   Up 2 seconds   0.0.0.0:8428->8428/tcp, :::8428->8428/tcp   victoria-metrics
如何访问呢?
没有表的概念
这里对于vm的初学者(mysql的非初学者)需要做出解释,像关系型数据库,有服务之后还需要创建连接,还需要建库,建表,然后不管用原生sql还是什么其它封装了sql的框架组件进行查询;
但是vm拉起服务后就结束了,它是非关系型数据库没有表的概念,用个不完全贴切的比喻,就像一锅“大杂烩”;
那么数据怎么插?怎么查?
vm 的基本概念
想要回答这个问题,就必须要明白几个概念(只是quickstart,还有很多概念和语法请自行参阅官方文档):
指标:这是vm中数据的标识,查vm就是查vm中的指标值
标签:指标可以有多个标签,主要用来按照某种逻辑筛选同类型指标
那么,指标名+标签 => 唯一确定了一个时间序列,也就是一个时间序列上的指标值,下面这个例子的指标名就是CPU_OCCUPIED,代表cpu占用率,{machine=”2”,process_id=”1”}就是标签,代表了机器id和进程id,也就是说这个指标记录了id为2的机器上进程id为1的进程在一段时间序列中每分钟的cpu占用率
# CPU_OCCUPIED{machine="2",process_id="1"}
timestamp        value
12:01             66
12:02             65
12:03             78
所以数据是存在由指标和标签确定的一个时间序列中的,只有你向vm中插入指标值,这个指标才会存在!
查询则需要用vm提供的ui客户端中()写metricql/promql查询和插入数据:
一旦容器启动,可以通过访问
http://localhost:8428/vmui/?#/?g0.range_input=30m&g0.end_input=2023-11-14T09%3A44%3A40&g0.tab=0&g0.relative_time=last_30_minutes
来访问VictoriaMetrics的Web界面。
可以使用该界面来管理和监控你的指标数据。
curl 测试简单例子
插入
JSON 数据格式
{
  // metric contans metric name plus labels for a particular time series
  "metric":{
    "__name__": "metric_name",  // <- this is metric name

    // Other labels for the time series

    "label1": "value1",
    "label2": "value2",
    ...
    "labelN": "valueN"
  },

  // values contains raw sample values for the given time series
  "values": [1, 2.345, -678],

  // timestamps contains raw sample UNIX timestamps in milliseconds for the given time series
  // every timestamp is associated with the value at the corresponding position
  "timestamps": [1549891472010,1549891487724,1549891503438]
}
curl 插入
默认看起来可以插入多个时间和值。
curl 'http://127.0.0.1:8428/api/v1/import' \
-H "Content-Type:application/json" \
-X POST \
-d '{"metric":{"__name__":"testVm","hostname":"localhost"},"values":[30,40,50],"timestamps":[1713493018327,1713493018328,1713493018329]}'
__name__ 对应的值指标名称。
后面的 hostname=localhost 对应其他的文本 label 和值。
插入单个呢?
curl 'http://127.0.0.1:8428/api/v1/import' \
-H "Content-Type:application/json" \
-X POST \
-d '{"metric":{"__name__":"testVm","hostname":"127.0.0.1"},"values":[77],"timestamps":[1713493018327]}'
1713493018327 这个最好是当前时间。
curl 查询
我们可以指定 metric 的名字进行查询。
curl 'http://localhost:8428/api/v1/export' -d 'match={__name__="testVm"}'
如下:
$ curl 'http://localhost:8428/api/v1/export' -d 'match={__name__="testVm"}'
{"metric":{"__name__":"testVm","hostname":"127.0.0.1"},"values":[77,66],"timestamps":[1713493018327,1713493018327]}
{"metric":{"__name__":"testVm","hostname":"localhost"},"values":[30,40,50],"timestamps":[1713493018327,1713493018328,1713493018329]}
看的出来,一次性的多个值和时间戳,会被认为还是一条记录。
curl 删除?
似乎没有这个需求?
批量 curl 操作
curl 'http://127.0.0.1:8428/api/v1/import' \
-H "Content-Type:application/json" \
-X POST \
-d '{"metric":{"__name__":"testVm2","hostname":"127.0.0.1"},"values":[77],"timestamps":[1713493018327]}'
查询:
curl 'http://localhost:8428/api/v1/export' -d 'match={__name__="testVm2"}'
批量呢
插入 2 个不同的值,会怎么样?
curl 'http://127.0.0.1:8428/api/v1/import' \
-H "Content-Type:application/json" \
-X POST \
-d '{"metric":{"__name__":"testVmTimes","hostname":"127.0.0.1"},"values":[77],"timestamps":[1713493018327]}'
+
curl 'http://127.0.0.1:8428/api/v1/import' \
-H "Content-Type:application/json" \
-X POST \
-d '{"metric":{"__name__":"testVmTimes","hostname":"127.0.0.1"},"values":[78],"timestamps":[1713493018326]}'
发现会被自动合并:
$ curl 'http://localhost:8428/api/v1/export' -d 'match={__name__="testVmTimes"}'
{"metric":{"__name__":"testVmTimes","hostname":"127.0.0.1"},"values":[78,77],"timestamps":[1713493018326,1713493018327]}
解释
在VictoriaMetrics中,如果两个数据点具有相同的指标名(metric name)和相同的标签集(label set),它们会被认为属于同一个时间序列(time series)。在您提供的例子中,两个不同的curl命令尝试向同一个时间序列(testVmTimes)插入数据,并且都使用了相同的指标名和标签集(hostname="127.0.0.1")。
当您尝试向同一个时间序列插入两个不同的值时,VictoriaMetrics会根据其内部的合并策略来处理这些数据点。默认情况下,VictoriaMetrics可能会执行以下操作之一:
-
保留最新的数据点:在您的例子中,时间戳为
1713493018326的数据点比时间戳为1713493018327的数据点更早,因此,根据默认行为,VictoriaMetrics保留了时间戳更早的数据点(78)。 -
合并数据点:如果VictoriaMetrics配置了特定的合并策略,它可能会将两个数据点合并为一个,或者根据其他规则(如求平均值、求和等)来处理这些数据点。
在您的例子中,看起来VictoriaMetrics选择了保留时间戳更早的数据点。这可能是因为在默认情况下,VictoriaMetrics倾向于保留时间戳更早的数据点,或者您的VictoriaMetrics实例配置了某种特定的合并策略。
如果您希望避免数据点被合并,您需要确保每个数据点都有唯一的时间戳,或者使用不同的指标名或标签集来区分不同的时间序列。
请注意,VictoriaMetrics的行为可能会根据您的具体配置和版本有所不同。如果您需要更精确的控制数据点的合并行为,您可能需要查阅VictoriaMetrics的官方文档或配置指南,以了解如何调整这些设置。
不同的 label
curl 'http://127.0.0.1:8428/api/v1/import' \
-H "Content-Type:application/json" \
-X POST \
-d '{"metric":{"__name__":"testVmTimes","hostname":"127.0.0.2"},"values":[72],"timestamps":[1713493018322]}'
结果:
$ curl 'http://localhost:8428/api/v1/export' -d 'match={__name__="testVmTimes"}'
{"metric":{"__name__":"testVmTimes","hostname":"127.0.0.1"},"values":[79,78,77],"timestamps":[1713493018127,1713493018326,1713493018327]}
{"metric":{"__name__":"testVmTimes","hostname":"127.0.0.2"},"values":[72],"timestamps":[1713493018322]}
count 测试
插入:
curl 'http://127.0.0.1:8428/api/v1/import' \
-H "Content-Type:application/json" \
-X POST \
-d '{"metric":{"__name__":"testVmCount","hostname":"127.0.0.1"},"values":[72],"timestamps":[1713493018322]}'
curl 'http://127.0.0.1:8428/api/v1/import' \
-H "Content-Type:application/json" \
-X POST \
-d '{"metric":{"__name__":"testVmCount","hostname":"127.0.0.2"},"values":[73],"timestamps":[1713493015322]}'
查询:
$ curl 'http://localhost:8428/api/v1/export' -d 'match={__name__="testVmCount"}'
{"metric":{"__name__":"testVmCount","hostname":"127.0.0.1"},"values":[72],"timestamps":[1713493018322]}
{"metric":{"__name__":"testVmCount","hostname":"127.0.0.2"},"values":[73],"timestamps":[1713493015322]}
尝试查询
curl 'http://localhost:8428/api/v1/query_range' \
     -d 'query=count({__name__="testVmCount"})' \
     -d 'start=1713493015322' \
     -d 'end=1713493018322' \
     -d 'step=1s'
结果:
 curl 'http://localhost:8428/api/v1/query_range' \
     -d 'query=count({__name__="testVmCount"})' \
     -d 'start=1713493015322' \
     -d 'end=1713493018322' \
     -d 'step=1s'

{"status":"success","data":{"resultType":"matrix","result":[{"metric":{},"values":[[1713493015.322,"1"],[1713493016.322,"1"],[1713493017.322,"1"],[1713493018.322,"2"]]}]},"stats":{"seriesFetched": "2","executionTimeMsec":0}}
相同标签
curl 'http://127.0.0.1:8428/api/v1/import' \
-H "Content-Type:application/json" \
-X POST \
-d '{"metric":{"__name__":"testVmCount","hostname":"127.0.0.2"},"values":[75],"timestamps":[1713493019322]}'
数据:
$ curl 'http://localhost:8428/api/v1/export' -d 'match={__name__="testVmCount"}'
{"metric":{"__name__":"testVmCount","hostname":"127.0.0.1"},"values":[72],"timestamps":[1713493018322]}
{"metric":{"__name__":"testVmCount","hostname":"127.0.0.2"},"values":[73,75],"timestamps":[1713493015322,1713493019322]}
count
curl 'http://localhost:8428/api/v1/query_range' \
     -d 'query=count({__name__="testVmCount"})' \
     -d 'start=1713493015322' \
     -d 'end=1713493019322' \
     -d 'step=1s'
{"status":"success","data":{"resultType":"matrix","result":[{"metric":{},"values":[[1713493015.322,"1"],[1713493016.322,"1"],[1713493017.322,"1"],[1713493018.322,"2"],[1713493019.322,"2"]]}]},"stats":{"seriesFetched": "2","executionTimeMsec":1}}
解释
kimi:
根据您提供的查询结果,这里是对输出的解释:

1. **status**: `"success"` 表示查询已成功执行。

2. **data**:
   - **resultType**: `"matrix"` 表示返回的数据是矩阵格式,这是VictoriaMetrics用于表示时间序列数据的标准格式。
   - **result**: 这是一个包含单个元素的数组,每个元素代表一个时间序列。在您的查询中,只有一个时间序列匹配您的查询条件 `count({__name__="testVmCount"})`。

     该时间序列的数据如下:
     - **metric**: `{}` 表示没有额外的标签(labels)与这个时间序列关联,或者返回的结果中标签被省略了。
     - **values**: 是一个二维数组,其中每个内部数组包含两个元素:时间戳和对应的值。在您的结果中:
       - `[1713493015.322,"1"]` 表示在时间戳 `1713493015.322` 秒时,`count` 的值是 `1`。
       - `[1713493016.322,"1"]` 表示在时间戳 `1713493016.322` 秒时,`count` 的值是 `1`。
       - `[1713493017.322,"1"]` 表示在时间戳 `1713493017.322` 秒时,`count` 的值是 `1`。
       - `[1713493018.322,"2"]` 表示在时间戳 `1713493018.322` 秒时,`count` 的值增加到了 `2`。

3. **stats**:
   - **seriesFetched**: `"2"` 表示查询过程中获取了2个时间序列。这可能意味着在您的数据中,有两个不同的时间序列具有不同的标签集合,但都与指标名 `testVmCount` 匹配。
   - **executionTimeMsec**: `"0"` 表示查询执行的时间是0毫秒,这表明查询非常快地完成了。

从结果来看,您的查询在指定的时间范围内统计了名为 `testVmCount` 的时间序列的数量。在前三个时间点上,每个时间点都有一个时间序列,而在最后一个时间点上,有两个时间序列。

请注意,返回的 `count` 值是作为字符串 `"1"` 和 `"2"` 提供的,而不是数字。在某些情况下,您可能需要在客户端将这些字符串转换为数字以进行进一步的处理或分析。

此外,由于查询结果中的 `metric` 字段是空的,如果您需要关于时间序列的完整标签信息,您可能需要调整查询或检查VictoriaMetrics的文档,了解如何使返回结果包含完整的标签集。
curl 测试
插入
curl 'http://127.0.0.1:8428/api/v1/import' \
-H "Content-Type:application/json" \
-X POST \
-d '{"Id":"12330245","visitTimes":1,"docType":"散文","docId":"36e5854f5f0e4f80b7ccc6c52c063243"}'
json 格式
官方的例子:
{
  // metric contans metric name plus labels for a particular time series
  "metric":{
    "__name__": "metric_name",  // <- this is metric name

    // Other labels for the time series

    "label1": "value1",
    "label2": "value2",
    ...
    "labelN": "valueN"
  },

  // values contains raw sample values for the given time series
  "values": [1, 2.345, -678],

  // timestamps contains raw sample UNIX timestamps in milliseconds for the given time series
  // every timestamp is associated with the value at the corresponding position
  "timestamps": [1549891472010,1549891487724,1549891503438]
}
我们给一个简单的 json
{
  "metric":{
    "__name__": "CPU_OCCUPIED",
    "hostname": "localhost"
  },
  "values": [30, 40, 50],
  "timestamps": [1549891472010,1549891487724,1549891503438]
}
压缩:
{"metric":{"__name__":"CPU_OCCUPIED","hostname":"localhost"},"values":[30,40,50],"timestamps":[1709701935891,1709701935991,1709701935899]}
请求:
curl 'http://127.0.0.1:8428/api/v1/import' \
-H "Content-Type:application/json" \
-X POST \
-d '{"metric":{"__name__":"CPU_OCCUPIED","hostname":"localhost"},"values":[30,40,50],"timestamps":[1709701935891,1709701935991,1709701935899]}'
实时查询
即使查询在给定时间戳执行查询表达式:
GET | POST /api/v1/query?query=...&time=...&step=...
参数:
query- MetricSQL表达式。 time- 可选,以秒精度计算at 的时间戳query。如果省略,time则设置为now()(当前时间戳)。可以用多种允许的格式指定time参数。 step- 可选,执行时搜索过去的原始样本的最大间隔query。
测试例子
curl 'http://127.0.0.1:8428/api/v1/query?query=CPU_OCCUPIED'
但是发现查询的数据为空:
{"status":"success","data":{"resultType":"vector","result":[]},"stats":{"seriesFetched": "0","executionTimeMsec":0}}
我们指定时间试一下:
curl 'http://127.0.0.1:8428/api/v1/query?query=CPU_OCCUPIED&time=1549891472010'
发现还是没有…
python 操作 vm
python 脚本
import time
import json
import requests
import urllib3

def insert_into_vm2(business, data_source, ad_task, ts, rows, product_type=1):
    # VictoriaMetrics 的地址和端口
    url = 'http://127.0.0.1:8428/api/v1/import'
    # json数据
    data = json.dumps({
        "metric": {
            "__name__": "analysis_data_volume_rows",    # {__name__="ask" or __name__="bid"} 查询ask或bid的数据
            "business": str(business),
            "data_source": str(data_source),
            "ad_task": str(ad_task),
            "product_type": str(product_type)
        },
        "values": [rows],
        "timestamps": [ts]    # 需要int
    })

    # 配置并发请求
    headers = {"Content-Type": "application/json"}
    http_pool = urllib3.PoolManager()
    response = http_pool.request('POST', url, body=data, headers=headers)
    print(response.status, f"data is {response.data}")
vm 的 push 模式
既然是指标监控,那么就需要application以推送的模式发送到服务器,至于发送的时间和数据格式由应用程序决定,这也就是push模式以
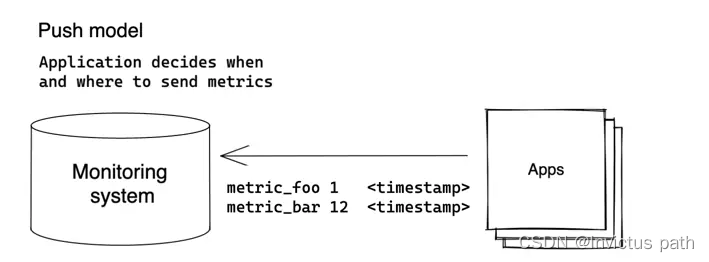
VictoriaMetrics 在 /api/v1/import 接受 JSON 行格式的数据,并在 /api/v1/export 导出此格式的数据。
格式遵循JSON 流概念,例如每行包含 JSON 对象,其指标数据采用以下格式():
{
  # metric contans metric name plus labels for a particular time series
  "metric":{
    "__name__": "metric_name",  # this is metric name

    # Other labels for the time series

    "label1": "value1",
    "label2": "value2",
    ...
    "labelN": "valueN"
  },

  # values contains raw sample values for the given time series
  "values": [1, 2.345, -678],

  # timestamps contains raw sample UNIX timestamps in milliseconds for the given time series
  # every timestamp is associated with the value at the corresponding position
  "timestamps": [1549891472010,1549891487724,1549891503438]
}
所以我们插入数据的url和准备的数据才会是那样写的,__name__就是指标名,label就是标签名,value就是指标值,timestamp就是时间戳,只需要把字典json.dumps变成json串就可以了
所以我们也可以使用 postman / curl 发送一个请求。
参考资料
https://github.com/VictoriaMetrics/VictoriaMetrics
https://hertzbeat.com/zh-cn/docs/start/victoria-metrics-init/
https://blog.csdn.net/qq_47501059/article/details/135111923
https://blog.csdn.net/weixin_45771607/article/details/135452800
更多学习
更多实时资讯,前沿技术,生活趣事。尽在【老马啸西风】
交流社群:[交流群信息](https://mp.weixin.qq.com/s/rkSvXxiiLGjl3S-ZOZCr0Q)