回顾
大家好,我是老马。
最近 dubbo3.x 在公司内部分享,于是想系统梳理一下。
总体思路是官方文档入门+一些场景的问题思考+源码解析学习。
https://cn.dubbo.apache.org/zh-cn/blog/2023/02/20/%E6%8C%87%E6%A0%87%E5%9F%8B%E7%82%B9/
1. 指标接入说明
2. 指标体系设计
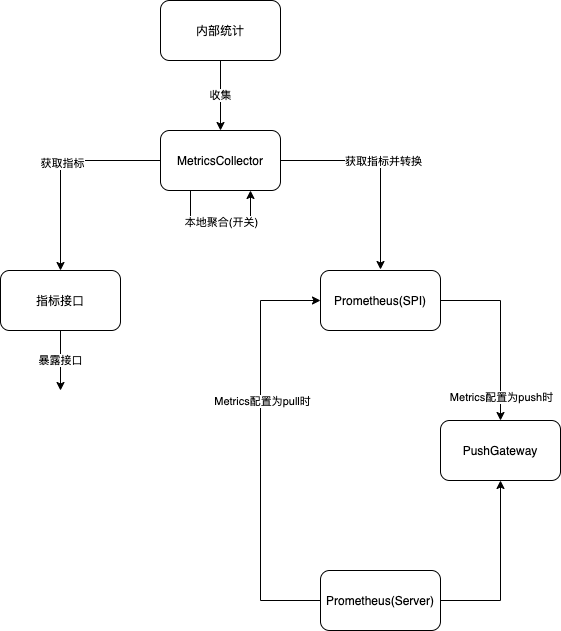
Dubbo的指标体系,总共涉及三块,指标收集、本地聚合、指标推送
指标收集:将Dubbo内部需要监控的指标推送至统一的Collector中进行存储
本地聚合:指标收集获取的均为基础指标,而一些分位数指标则需通过本地聚合计算得出
指标推送:收集和聚合后的指标通过一定的方式推送至第三方服务器,目前只涉及Prometheus
3. 结构设计
移除原来与 Metrics 相关的类
创建新模块 dubbo-metrics/dubbo-metrics-api、dubbo-metrics/dubbo-metrics-prometheus,MetricsConfig 作为该模块的配置类
使用micrometer,在Collector中使用基本类型代表指标,如Long、Double等,并在dubbo-metrics-api中引入micrometer,由micrometer对内部指标进行转换
4. 数据流转
5. 目标
指标接口将提供一个 MetricsService,该 Service 不仅提供柔性服务所的接口级数据,也提供所有指标的查询方式,其中方法级指标的查询的接口可按如下方式声明
public interface MetricsService {

    /**
     * Default {@link MetricsService} extension name.
     */
    String DEFAULT_EXTENSION_NAME = "default";

    /**
     * The contract version of {@link MetricsService}, the future update must make sure compatible.
     */
    String VERSION = "1.0.0";

    /**
     * Get metrics by prefixes
     *
     * @param categories categories
     * @return metrics - key=MetricCategory value=MetricsEntityList
     */
    Map<MetricsCategory, List<MetricsEntity>> getMetricsByCategories(List<MetricsCategory> categories);

    /**
     * Get metrics by interface and prefixes
     *
     * @param serviceUniqueName serviceUniqueName (eg.group/interfaceName:version)
     * @param categories categories
     * @return metrics - key=MetricCategory value=MetricsEntityList
     */
    Map<MetricsCategory, List<MetricsEntity>> getMetricsByCategories(String serviceUniqueName, List<MetricsCategory> categories);

    /**
     * Get metrics by interface、method and prefixes
     *
     * @param serviceUniqueName serviceUniqueName (eg.group/interfaceName:version)
     * @param methodName methodName
     * @param parameterTypes method parameter types
     * @param categories categories
     * @return metrics - key=MetricCategory value=MetricsEntityList
     */
    Map<MetricsCategory, List<MetricsEntity>> getMetricsByCategories(String serviceUniqueName, String methodName, Class<?>[] parameterTypes, List<MetricsCategory> categories);
}
其中 MetricsCategory 设计如下:
public enum MetricsCategory {
    RT,
    QPS,
    REQUESTS,
}
MetricsEntity 设计如下
public class MetricsEntity {
    private String name;
    private Map<String, String> tags;
    private MetricsCategory category;
    private Object value;
}
指标收集
1. 嵌入位置
Dubbo 架构图如下
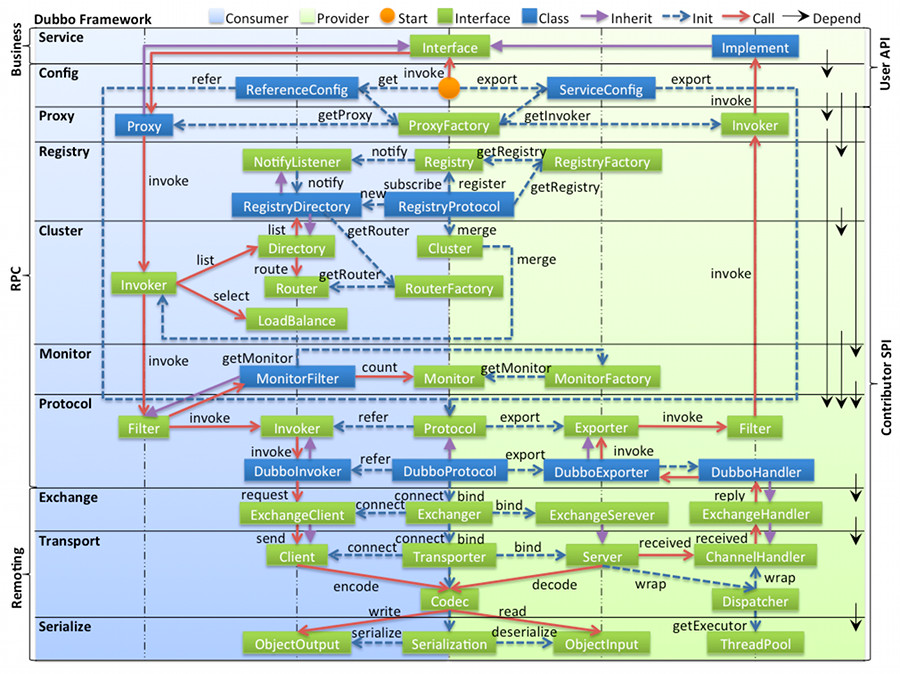
在 provider 中添加一层 MetricsFilter 重写 invoke 方法嵌入调用链路用于收集指标,用 try-catch-finally 处理,核心代码如下
@Activate(group = PROVIDER, order = -1)
public class MetricsFilter implements Filter, ScopeModelAware {
    @Override
    public Result invoke(Invoker<?> invoker, Invocation invocation) throws RpcException {
        collector.increaseTotalRequests(interfaceName, methodName, group, version);
        collector.increaseProcessingRequests(interfaceName, methodName, group, version);
        Long startTime = System.currentTimeMillis();
        try {
            Result invoke = invoker.invoke(invocation);
            collector.increaseSucceedRequests(interfaceName, methodName, group, version);
            return invoke;
        } catch (RpcException e) {
            collector.increaseFailedRequests(interfaceName, methodName, group, version);
            throw e;
        } finally {
            Long endTime = System.currentTimeMillis();
            Long rt = endTime - startTime;
            collector.addRT(interfaceName, methodName, group, version, rt);
            collector.decreaseProcessingRequests(interfaceName, methodName, group, version);
        }
    }
}
2. 指标标识
用以下五个属性作为隔离级别区分标识不同方法,也是各个 ConcurrentHashMap 的 key
public class MethodMetric {
    private String applicationName;
    private String interfaceName;
    private String methodName;
    private String group;
    private String version;
}
3. 基础指标
指标通过 common 模块下的 MetricsCollector 存储所有指标数据
public class DefaultMetricsCollector implements MetricsCollector {
    private Boolean collectEnabled = false;
    private final List<MetricsListener> listeners = new ArrayList<>();
    private final ApplicationModel applicationModel;
    private final String applicationName;

    private final Map<MethodMetric, AtomicLong> totalRequests = new ConcurrentHashMap<>();
    private final Map<MethodMetric, AtomicLong> succeedRequests = new ConcurrentHashMap<>();
    private final Map<MethodMetric, AtomicLong> failedRequests = new ConcurrentHashMap<>();
    private final Map<MethodMetric, AtomicLong> processingRequests = new ConcurrentHashMap<>();

    private final Map<MethodMetric, AtomicLong> lastRT = new ConcurrentHashMap<>();
    private final Map<MethodMetric, LongAccumulator> minRT = new ConcurrentHashMap<>();
    private final Map<MethodMetric, LongAccumulator> maxRT = new ConcurrentHashMap<>();
    private final Map<MethodMetric, AtomicLong> avgRT = new ConcurrentHashMap<>();
    private final Map<MethodMetric, AtomicLong> totalRT = new ConcurrentHashMap<>();
    private final Map<MethodMetric, AtomicLong> rtCount = new ConcurrentHashMap<>();
 }
本地聚合
本地聚合指将一些简单的指标通过计算获取各分位数指标的过程
1. 参数设计
收集指标时,默认只收集基础指标,而一些单机聚合指标则需要开启服务柔性或者本地聚合后另起线程计算。此处若开启服务柔性,则本地聚合默认开启
1.1 本地聚合开启方式
<dubbo:metrics>
  <dubbo:aggregation enable="true" />
</dubbo:metrics>
1.2 指标聚合参数
<dubbo:metrics>
  <dubbo:aggregation enable="true" bucket-num="5" time-window-seconds="10"/>
</dubbo:metrics>
2. 具体指标
Dubbo的指标模块帮助用户从外部观察正在运行的系统的内部服务状况 ,Dubbo参考 “四大黄金信号”、RED方法、USE方法等理论并结合实际企业应用场景从不同维度统计了丰富的关键指标,关注这些核心指标对于提供可用性的服务是至关重要的。
Dubbo的关键指标包含:延迟(Latency)、流量(Traffic)、 错误(Errors) 和 饱和度(Saturation) 等内容 。
同时,为了更好的监测服务运行状态,Dubbo 还提供了对核心组件状态的监控,如Dubbo应用信息、线程池信息、三大中心交互的指标数据等。
在Dubbo中主要包含如下监控指标:
| 分类 | 基础设施 | 业务监控 |
|---|---|---|
| 延迟类 | IO 等待;网络延迟 | 接口、服务的平均耗时、TP90、TP99、TP999 等 |
| 流量类 | 网络和磁盘 IO | 服务层面的 QPS |
| 错误类 | 宕机;磁盘(坏盘或文件系统错误);进程或端口挂掉;网络丢包 | 错误日志;业务状态码、错误码走势 |
| 饱和度类 | 系统资源利用率:CPU、内存、磁盘、网络等;饱和度:等待线程数,队列积压长度 | 主要包含 JVM、线程池等 |
你可以将这段 Markdown 代码复制到支持 Markdown 的编辑器中查看效果。
qps: 基于滑动窗口获取动态qps rt: 基于滑动窗口获取动态rt 失败请求数: 基于滑动窗口获取最近时间内的失败请求数 成功请求数: 基于滑动窗口获取最近时间内的成功请求数 处理中请求数: 前后增加Filter简单统计 具体指标依赖滑动窗口,额外使用 AggregateMetricsCollector 收集
输出到普罗米修斯的相关指标可以参考的内容如下:
# HELP jvm_gc_live_data_size_bytes Size of long-lived heap memory pool after reclamation
# TYPE jvm_gc_live_data_size_bytes gauge
jvm_gc_live_data_size_bytes 1.6086528E7
# HELP requests_succeed_aggregate Aggregated Succeed Requests
# TYPE requests_succeed_aggregate gauge
requests_succeed_aggregate{application_name="metrics-provider",group="",hostname="iZ8lgm9icspkthZ",interface="org.apache.dubbo.samples.metrics.prometheus.api.DemoService",ip="172.28.236.104",method="sayHello",version="",} 39.0
# HELP jvm_buffer_memory_used_bytes An estimate of the memory that the Java virtual machine is using for this buffer pool
# TYPE jvm_buffer_memory_used_bytes gauge
jvm_buffer_memory_used_bytes{id="direct",} 1.679975E7
jvm_buffer_memory_used_bytes{id="mapped",} 0.0
# HELP jvm_gc_memory_allocated_bytes_total Incremented for an increase in the size of the (young) heap memory pool after one GC to before the next
# TYPE jvm_gc_memory_allocated_bytes_total counter
jvm_gc_memory_allocated_bytes_total 2.9884416E9
# HELP requests_total_aggregate Aggregated Total Requests
# TYPE requests_total_aggregate gauge
requests_total_aggregate{application_name="metrics-provider",group="",hostname="iZ8lgm9icspkthZ",interface="org.apache.dubbo.samples.metrics.prometheus.api.DemoService",ip="172.28.236.104",method="sayHello",version="",} 39.0
# HELP system_load_average_1m The sum of the number of runnable entities queued to available processors and the number of runnable entities running on the available processors averaged over a period of time
# TYPE system_load_average_1m gauge
system_load_average_1m 0.0
# HELP system_cpu_usage The "recent cpu usage" for the whole system
# TYPE system_cpu_usage gauge
system_cpu_usage 0.015802269043760128
# HELP jvm_threads_peak_threads The peak live thread count since the Java virtual machine started or peak was reset
# TYPE jvm_threads_peak_threads gauge
jvm_threads_peak_threads 40.0
# HELP requests_processing Processing Requests
# TYPE requests_processing gauge
requests_processing{application_name="metrics-provider",group="",hostname="iZ8lgm9icspkthZ",interface="org.apache.dubbo.samples.metrics.prometheus.api.DemoService",ip="172.28.236.104",method="sayHello",version="",} 0.0
# HELP jvm_memory_max_bytes The maximum amount of memory in bytes that can be used for memory management
# TYPE jvm_memory_max_bytes gauge
jvm_memory_max_bytes{area="nonheap",id="CodeHeap 'profiled nmethods'",} 1.22912768E8
jvm_memory_max_bytes{area="heap",id="G1 Survivor Space",} -1.0
jvm_memory_max_bytes{area="heap",id="G1 Old Gen",} 9.52107008E8
jvm_memory_max_bytes{area="nonheap",id="Metaspace",} -1.0
jvm_memory_max_bytes{area="heap",id="G1 Eden Space",} -1.0
jvm_memory_max_bytes{area="nonheap",id="CodeHeap 'non-nmethods'",} 5828608.0
jvm_memory_max_bytes{area="nonheap",id="Compressed Class Space",} 1.073741824E9
jvm_memory_max_bytes{area="nonheap",id="CodeHeap 'non-profiled nmethods'",} 1.22916864E8
# HELP jvm_threads_states_threads The current number of threads having BLOCKED state
# TYPE jvm_threads_states_threads gauge
jvm_threads_states_threads{state="blocked",} 0.0
jvm_threads_states_threads{state="runnable",} 10.0
jvm_threads_states_threads{state="waiting",} 16.0
jvm_threads_states_threads{state="timed-waiting",} 13.0
jvm_threads_states_threads{state="new",} 0.0
jvm_threads_states_threads{state="terminated",} 0.0
# HELP jvm_buffer_total_capacity_bytes An estimate of the total capacity of the buffers in this pool
# TYPE jvm_buffer_total_capacity_bytes gauge
jvm_buffer_total_capacity_bytes{id="direct",} 1.6799749E7
jvm_buffer_total_capacity_bytes{id="mapped",} 0.0
# HELP rt_p99 Response Time P99
# TYPE rt_p99 gauge
rt_p99{application_name="metrics-provider",group="",hostname="iZ8lgm9icspkthZ",interface="org.apache.dubbo.samples.metrics.prometheus.api.DemoService",ip="172.28.236.104",method="sayHello",version="",} 1.0
# HELP jvm_memory_used_bytes The amount of used memory
# TYPE jvm_memory_used_bytes gauge
jvm_memory_used_bytes{area="heap",id="G1 Survivor Space",} 1048576.0
jvm_memory_used_bytes{area="nonheap",id="CodeHeap 'profiled nmethods'",} 1.462464E7
jvm_memory_used_bytes{area="heap",id="G1 Old Gen",} 1.6098728E7
jvm_memory_used_bytes{area="nonheap",id="Metaspace",} 4.0126952E7
jvm_memory_used_bytes{area="heap",id="G1 Eden Space",} 8.2837504E7
jvm_memory_used_bytes{area="nonheap",id="CodeHeap 'non-nmethods'",} 1372032.0
jvm_memory_used_bytes{area="nonheap",id="Compressed Class Space",} 4519248.0
jvm_memory_used_bytes{area="nonheap",id="CodeHeap 'non-profiled nmethods'",} 5697408.0
# HELP qps Query Per Seconds
# TYPE qps gauge
qps{application_name="metrics-provider",group="",hostname="iZ8lgm9icspkthZ",interface="org.apache.dubbo.samples.metrics.prometheus.api.DemoService",ip="172.28.236.104",method="sayHello",version="",} 0.3333333333333333
# HELP rt_min Min Response Time
# TYPE rt_min gauge
rt_min{application_name="metrics-provider",group="",hostname="iZ8lgm9icspkthZ",interface="org.apache.dubbo.samples.metrics.prometheus.api.DemoService",ip="172.28.236.104",method="sayHello",version="",} 0.0
# HELP jvm_buffer_count_buffers An estimate of the number of buffers in the pool
# TYPE jvm_buffer_count_buffers gauge
jvm_buffer_count_buffers{id="mapped",} 0.0
jvm_buffer_count_buffers{id="direct",} 10.0
# HELP system_cpu_count The number of processors available to the Java virtual machine
# TYPE system_cpu_count gauge
system_cpu_count 2.0
# HELP jvm_classes_loaded_classes The number of classes that are currently loaded in the Java virtual machine
# TYPE jvm_classes_loaded_classes gauge
jvm_classes_loaded_classes 7325.0
# HELP rt_total Total Response Time
# TYPE rt_total gauge
rt_total{application_name="metrics-provider",group="",hostname="iZ8lgm9icspkthZ",interface="org.apache.dubbo.samples.metrics.prometheus.api.DemoService",ip="172.28.236.104",method="sayHello",version="",} 2783.0
# HELP rt_last Last Response Time
# TYPE rt_last gauge
rt_last{application_name="metrics-provider",group="",hostname="iZ8lgm9icspkthZ",interface="org.apache.dubbo.samples.metrics.prometheus.api.DemoService",ip="172.28.236.104",method="sayHello",version="",} 0.0
# HELP jvm_gc_memory_promoted_bytes_total Count of positive increases in the size of the old generation memory pool before GC to after GC
# TYPE jvm_gc_memory_promoted_bytes_total counter
jvm_gc_memory_promoted_bytes_total 1.4450952E7
# HELP jvm_gc_pause_seconds Time spent in GC pause
# TYPE jvm_gc_pause_seconds summary
jvm_gc_pause_seconds_count{action="end of minor GC",cause="Metadata GC Threshold",} 2.0
jvm_gc_pause_seconds_sum{action="end of minor GC",cause="Metadata GC Threshold",} 0.026
jvm_gc_pause_seconds_count{action="end of minor GC",cause="G1 Evacuation Pause",} 37.0
jvm_gc_pause_seconds_sum{action="end of minor GC",cause="G1 Evacuation Pause",} 0.156
# HELP jvm_gc_pause_seconds_max Time spent in GC pause
# TYPE jvm_gc_pause_seconds_max gauge
jvm_gc_pause_seconds_max{action="end of minor GC",cause="Metadata GC Threshold",} 0.0
jvm_gc_pause_seconds_max{action="end of minor GC",cause="G1 Evacuation Pause",} 0.0
# HELP rt_p95 Response Time P95
# TYPE rt_p95 gauge
rt_p95{application_name="metrics-provider",group="",hostname="iZ8lgm9icspkthZ",interface="org.apache.dubbo.samples.metrics.prometheus.api.DemoService",ip="172.28.236.104",method="sayHello",version="",} 0.0
# HELP requests_total Total Requests
# TYPE requests_total gauge
requests_total{application_name="metrics-provider",group="",hostname="iZ8lgm9icspkthZ",interface="org.apache.dubbo.samples.metrics.prometheus.api.DemoService",ip="172.28.236.104",method="sayHello",version="",} 27738.0
# HELP process_cpu_usage The "recent cpu usage" for the Java Virtual Machine process
# TYPE process_cpu_usage gauge
process_cpu_usage 8.103727714748784E-4
# HELP rt_max Max Response Time
# TYPE rt_max gauge
rt_max{application_name="metrics-provider",group="",hostname="iZ8lgm9icspkthZ",interface="org.apache.dubbo.samples.metrics.prometheus.api.DemoService",ip="172.28.236.104",method="sayHello",version="",} 4.0
# HELP jvm_gc_max_data_size_bytes Max size of long-lived heap memory pool
# TYPE jvm_gc_max_data_size_bytes gauge
jvm_gc_max_data_size_bytes 9.52107008E8
# HELP jvm_threads_live_threads The current number of live threads including both daemon and non-daemon threads
# TYPE jvm_threads_live_threads gauge
jvm_threads_live_threads 39.0
# HELP jvm_threads_daemon_threads The current number of live daemon threads
# TYPE jvm_threads_daemon_threads gauge
jvm_threads_daemon_threads 36.0
# HELP jvm_classes_unloaded_classes_total The total number of classes unloaded since the Java virtual machine has started execution
# TYPE jvm_classes_unloaded_classes_total counter
jvm_classes_unloaded_classes_total 0.0
# HELP jvm_memory_committed_bytes The amount of memory in bytes that is committed for the Java virtual machine to use
# TYPE jvm_memory_committed_bytes gauge
jvm_memory_committed_bytes{area="nonheap",id="CodeHeap 'profiled nmethods'",} 1.4680064E7
jvm_memory_committed_bytes{area="heap",id="G1 Survivor Space",} 1048576.0
jvm_memory_committed_bytes{area="heap",id="G1 Old Gen",} 5.24288E7
jvm_memory_committed_bytes{area="nonheap",id="Metaspace",} 4.1623552E7
jvm_memory_committed_bytes{area="heap",id="G1 Eden Space",} 9.0177536E7
jvm_memory_committed_bytes{area="nonheap",id="CodeHeap 'non-nmethods'",} 2555904.0
jvm_memory_committed_bytes{area="nonheap",id="Compressed Class Space",} 5111808.0
jvm_memory_committed_bytes{area="nonheap",id="CodeHeap 'non-profiled nmethods'",} 5701632.0
# HELP requests_succeed Succeed Requests
# TYPE requests_succeed gauge
requests_succeed{application_name="metrics-provider",group="",hostname="iZ8lgm9icspkthZ",interface="org.apache.dubbo.samples.metrics.prometheus.api.DemoService",ip="172.28.236.104",method="sayHello",version="",} 27738.0
# HELP rt_avg Average Response Time
# TYPE rt_avg gauge
rt_avg{application_name="metrics-provider",group="",hostname="iZ8lgm9icspkthZ",interface="org.apache.dubbo.samples.metrics.prometheus.api.DemoService",ip="172.28.236.104",method="sayHello",version="",} 0.0
聚合收集器
public class AggregateMetricsCollector implements MetricsCollector, MetricsListener {
    private int bucketNum;
    private int timeWindowSeconds;

    private final Map<MethodMetric, TimeWindowCounter> totalRequests = new ConcurrentHashMap<>();
    private final Map<MethodMetric, TimeWindowCounter> succeedRequests = new ConcurrentHashMap<>();
    private final Map<MethodMetric, TimeWindowCounter> failedRequests = new ConcurrentHashMap<>();
    private final Map<MethodMetric, TimeWindowCounter> qps = new ConcurrentHashMap<>();
    private final Map<MethodMetric, TimeWindowQuantile> rt = new ConcurrentHashMap<>();

    private final ApplicationModel applicationModel;

    private static final Integer DEFAULT_COMPRESSION = 100;
    private static final Integer DEFAULT_BUCKET_NUM = 10;
    private static final Integer DEFAULT_TIME_WINDOW_SECONDS = 120;

//在构造函数中解析配置信息

    public AggregateMetricsCollector(ApplicationModel applicationModel) {
        this.applicationModel = applicationModel;
        ConfigManager configManager = applicationModel.getApplicationConfigManager();
        MetricsConfig config = configManager.getMetrics().orElse(null);
        if (config != null && config.getAggregation() != null && Boolean.TRUE.equals(config.getAggregation().getEnabled())) {
            // only registered when aggregation is enabled.
            registerListener();

            AggregationConfig aggregation = config.getAggregation();
            this.bucketNum = aggregation.getBucketNum() == null ? DEFAULT_BUCKET_NUM : aggregation.getBucketNum();
            this.timeWindowSeconds = aggregation.getTimeWindowSeconds() == null ? DEFAULT_TIME_WINDOW_SECONDS : aggregation.getTimeWindowSeconds();
        }
    }
}
如果开启了本地聚合,则通过 spring 的 BeanFactory 添加监听,将 AggregateMetricsCollector 与 DefaultMetricsCollector 绑定,实现一种生产者消费者的模式,DefaultMetricsCollector 中使用监听器列表,方便扩展
private void registerListener() {
    applicationModel.getBeanFactory().getBean(DefaultMetricsCollector.class).addListener(this);
}
3. 指标聚合
滑动窗口 假设我们初始有6个bucket,每个窗口时间设置为2分钟 每次写入指标数据时,会将数据分别写入6个bucket内,每隔两分钟移动一个bucket并且清除原来bucket内的数据 读取指标时,读取当前current指向的bucket,以达到滑动窗口的效果 具体如下图所示,实现了当前 bucket 内存储了配置中设置的 bucket 生命周期内的数据,即近期数据
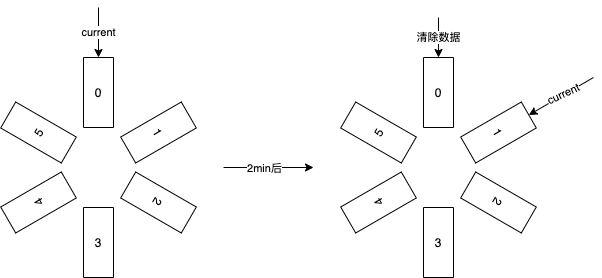
在每个bucket内,使用TDigest 算法计算分位数指标
TDigest 算法(极端分位精确度高,如p1 p99,中间分位精确度低,如p50),相关资料如下
https://op8867555.github.io/posts/2018-04-09-tdigest.html
https://blog.csdn.net/csdnnews/article/details/116246540
开源实现:https://github.com/tdunning/t-digest
代码实现如下,除了 TimeWindowQuantile 用来计算分位数指标外,另外提供了 TimeWindowCounter 来收集时间区间内的指标数量
public class TimeWindowQuantile {
    private final double compression;
    private final TDigest[] ringBuffer;
    private int currentBucket;
    private long lastRotateTimestampMillis;
    private final long durationBetweenRotatesMillis;

    public TimeWindowQuantile(double compression, int bucketNum, int timeWindowSeconds) {
        this.compression = compression;
        this.ringBuffer = new TDigest[bucketNum];
        for (int i = 0; i < bucketNum; i++) {
            this.ringBuffer[i] = TDigest.createDigest(compression);
        }

        this.currentBucket = 0;
        this.lastRotateTimestampMillis = System.currentTimeMillis();
        this.durationBetweenRotatesMillis = TimeUnit.SECONDS.toMillis(timeWindowSeconds) / bucketNum;
    }

    public synchronized double quantile(double q) {
        TDigest currentBucket = rotate();
        return currentBucket.quantile(q);
    }

    public synchronized void add(double value) {
        rotate();
        for (TDigest bucket : ringBuffer) {
            bucket.add(value);
        }
    }

    private TDigest rotate() {
        long timeSinceLastRotateMillis = System.currentTimeMillis() - lastRotateTimestampMillis;
        while (timeSinceLastRotateMillis > durationBetweenRotatesMillis) {
            ringBuffer[currentBucket] = TDigest.createDigest(compression);
            if (++currentBucket >= ringBuffer.length) {
                currentBucket = 0;
            }
            timeSinceLastRotateMillis -= durationBetweenRotatesMillis;
            lastRotateTimestampMillis += durationBetweenRotatesMillis;
        }
        return ringBuffer[currentBucket];
    }
}
指标推送
指标推送只有用户在设置了 <dubbo:metrics /> 配置且配置protocol参数后才开启,若只开启指标聚合,则默认不推送指标。
1. Promehteus Pull ServiceDiscovery
使用dubbo-admin等类似的中间层,启动时根据配置将本机 IP、Port、MetricsURL 推送地址信息至dubbo-admin(或任意中间层)的方式,暴露HTTP ServiceDiscovery供prometheus读取,配置方式如 <dubbo:metrics protocol=“prometheus” mode=“pull” address="${dubbo-admin.address}" port=“20888” url="/metrics"/>,其中在pull模式下address为可选参数,若不填则需用户手动在Prometheus配置文件中配置地址
private void exportHttpServer() {
    boolean exporterEnabled = url.getParameter(PROMETHEUS_EXPORTER_ENABLED_KEY, false);
    if (exporterEnabled) {
        int port = url.getParameter(PROMETHEUS_EXPORTER_METRICS_PORT_KEY, PROMETHEUS_DEFAULT_METRICS_PORT);
        String path = url.getParameter(PROMETHEUS_EXPORTER_METRICS_PATH_KEY, PROMETHEUS_DEFAULT_METRICS_PATH);
        if (!path.startsWith("/")) {
            path = "/" + path;
        }

        try {
            prometheusExporterHttpServer = HttpServer.create(new InetSocketAddress(port), 0);
            prometheusExporterHttpServer.createContext(path, httpExchange -> {
                String response = prometheusRegistry.scrape();
                httpExchange.sendResponseHeaders(200, response.getBytes().length);
                try (OutputStream os = httpExchange.getResponseBody()) {
                    os.write(response.getBytes());
                }
            });

            httpServerThread = new Thread(prometheusExporterHttpServer::start);
            httpServerThread.start();
        } catch (IOException e) {
            throw new RuntimeException(e);
        }
    }
}
2. Prometheus Push Pushgateway
用户直接在Dubbo配置文件中配置Prometheus Pushgateway的地址即可,如 <dubbo:metrics protocol=“prometheus” mode=“push” address="${prometheus.pushgateway-url}" interval=“5” />,其中interval代表推送间隔
private void schedulePushJob() {
    boolean pushEnabled = url.getParameter(PROMETHEUS_PUSHGATEWAY_ENABLED_KEY, false);
    if (pushEnabled) {
        String baseUrl = url.getParameter(PROMETHEUS_PUSHGATEWAY_BASE_URL_KEY);
        String job = url.getParameter(PROMETHEUS_PUSHGATEWAY_JOB_KEY, PROMETHEUS_DEFAULT_JOB_NAME);
        int pushInterval = url.getParameter(PROMETHEUS_PUSHGATEWAY_PUSH_INTERVAL_KEY, PROMETHEUS_DEFAULT_PUSH_INTERVAL);
        String username = url.getParameter(PROMETHEUS_PUSHGATEWAY_USERNAME_KEY);
        String password = url.getParameter(PROMETHEUS_PUSHGATEWAY_PASSWORD_KEY);

        NamedThreadFactory threadFactory = new NamedThreadFactory("prometheus-push-job", true);
        pushJobExecutor = Executors.newScheduledThreadPool(1, threadFactory);
        PushGateway pushGateway = new PushGateway(baseUrl);
        if (!StringUtils.isBlank(username)) {
            pushGateway.setConnectionFactory(new BasicAuthHttpConnectionFactory(username, password));
        }

        pushJobExecutor.scheduleWithFixedDelay(() -> push(pushGateway, job), pushInterval, pushInterval, TimeUnit.SECONDS);
    }
}

protected void push(PushGateway pushGateway, String job) {
    try {
        pushGateway.pushAdd(prometheusRegistry.getPrometheusRegistry(), job);
    } catch (IOException e) {
        logger.error("Error occurred when pushing metrics to prometheus: ", e);
    }
}
可视化展示
目前推荐使用 Prometheus 来进行服务监控,Grafana 来展示指标数据。
可以通过案例来快速入门 Dubbo 可视化监控。
参考资料
https://cn.dubbo.apache.org/zh-cn/blog/2023/05/26/google-paper-%E9%9D%A2%E5%90%91%E4%BA%91%E6%97%B6%E4%BB%A3%E7%9A%84%E5%BA%94%E7%94%A8%E5%BC%80%E5%8F%91%E6%96%B0%E6%A8%A1%E5%BC%8F/