一、前言:
前段时间移动项目想实现一个能实时绘制数学函数图像的H5小应用, app 通过 webview 进行嵌入,目前网上提供了大致有两种方法:
①、Chart.js 结合 Plugins 绘制 ===> https://www.bianchengquan.com/article/475747.html
②、原生 JavaScript + canvas 计算描点绘制 ===> https://blog.csdn.net/weixin_30341745/article/details/94964723
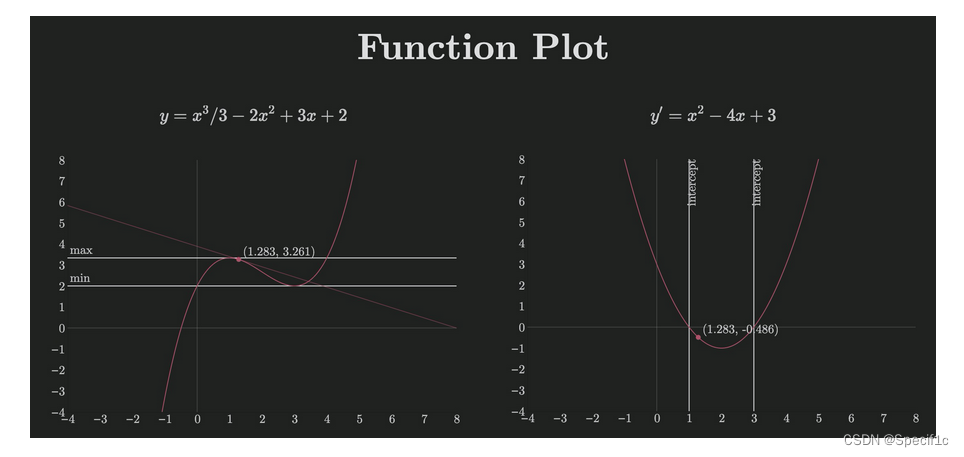
Function Plot
经过测试这两个方法应对一些复杂的函数图像绘制显得捉襟见肘,那么有没有什么库或者框架专门是用来绘制数学函数呢?
经过多方资料查找,发现了 function-plot.js 这款强大的数学函数绘制库:
Function Plot 是一个建立在 D3.js 之上的强大库,其目的是用很少的配置来渲染数学函数图像。
该库目前支持交互式折线图和散点图,每当修改坐标系比例时,都会使用新边界再次动态绘制函数!

就在我决定使用这个库来实现我的需求时,为了不想花时间去看英文文档,想着直接百度找个demo来快速入门,却发现网上对 function-plot.js 库的介绍与使用甚少,都是最最基础的属性使用,无法满足我的要求。
经过几个小时的英文开发文档学习,最终实现了想要的效果。
对官方文档绘制方法属性进行翻译,帮助码友降低学习成本。
官方文档:https://mauriciopoppe.github.io/function-plot/
快速入门
安装
npm i function-plot
或者 js 的方式
<script src="https://unpkg.com/function-plot/dist/function-plot.js"></script>
使用
<!DOCTYPE html>
<html lang="en">

<head>
	<meta charset="utf-8">
	<meta name="viewport" content="width=device-width, initial-scale=1, shrink-to-fit=no">
	<meta name="theme-color" content="#000000">
	<!--
      manifest.json provides metadata used when your web app is added to the
      homescreen on Android. See https://developers.google.com/web/fundamentals/engage-and-retain/web-app-manifest/
    -->
	<link rel="manifest" href="%PUBLIC_URL%/manifest.json">
	<link rel="shortcut icon" href="%PUBLIC_URL%/favicon.ico">
	<!--
      Notice the use of %PUBLIC_URL% in the tags above.
      It will be replaced with the URL of the `public` folder during the build.
      Only files inside the `public` folder can be referenced from the HTML.

      Unlike "/favicon.ico" or "favicon.ico", "%PUBLIC_URL%/favicon.ico" will
      work correctly both with client-side routing and a non-root public URL.
      Learn how to configure a non-root public URL by running `npm run build`.
    -->
	<title>React App</title>
</head>

<body>
	<noscript>
		You need to enable JavaScript to run this app.
	</noscript>
	<div id="root"></div>
	<!--
      This HTML file is a template.
      If you open it directly in the browser, you will see an empty page.

      You can add webfonts, meta tags, or analytics to this file.
      The build step will place the bundled scripts into the <body> tag.

      To begin the development, run `npm start` or `yarn start`.
      To create a production bundle, use `npm run build` or `yarn build`.
    -->
</body>

</html>
对应的 js
import functionPlot from "function-plot";

let contentsBounds = document.body.getBoundingClientRect();
let width = 800;
let height = 500;
let ratio = contentsBounds.width / width;
width *= ratio;
height *= ratio;

functionPlot({
  target: "#root",
  width,
  height,
  xAxis: { domain: [-3, 3] },
  grid: true,
  data: [
    {
      fn: "sqrt(1-(abs(x)-1)^2)"
    },
    {
      fn: "acos(1-abs(x)) - 3.1415926"
    }
  ]
});
可以绘制出对应的图形。
拓展
官网还有一些其他常见的例子。
极坐标
import functionPlot from "function-plot";

let contentsBounds = document.body.getBoundingClientRect();
let width = 800;
let height = 500;
let ratio = contentsBounds.width / width;
width *= ratio;
height *= ratio;

functionPlot({
  target: "#root",
  width,
  height,
  xAxis: { domain: [-6, 6] },
  grid: true,
  data: [{
    r: '2 * sin(4theta)',
    fnType: 'polar',
    graphType: 'polyline'
  }]
});
or
import functionPlot from "function-plot";

let contentsBounds = document.body.getBoundingClientRect();
let width = 800;
let height = 500;
let ratio = contentsBounds.width / width;
width *= ratio;
height *= ratio;

functionPlot({
  target: "#root",
  width,
  height,
  xAxis: { domain: [-6, 6] },
  grid: true,
  data: [{
    r: 'cos(3theta)',
    fnType: 'polar',
    graphType: 'polyline'
  }]
});
参考资料
https://blog.csdn.net/haduwi/article/details/125101592
https://mauriciopoppe.github.io/function-plot/
